Category Archives: what I do

DTracing the Cloud

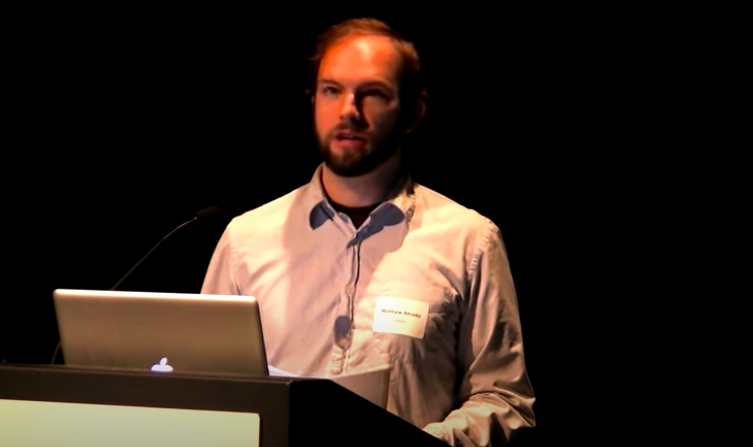
Brendan Gregg at illumos Day (an event I also organized and ran).

Cloud computing facilitates rapid deployment and scaling, often pushing high load at applications under continual development. DTrace allows immediate analysis of issues on live production systems even in these demanding environments – no need to restart or run a special debug kernel. For the illumos kernel, DTrace has been enhanced to support cloud computing, providing more observation capabilities to zones as used by Joyent SmartMachine customers. DTrace is also frequently used by the cloud operators to analyze systems and verify performance isolation of tenants. This talk covers DTrace in the illumos-based cloud, showing examples of real-world performance wins.


Why 4K?

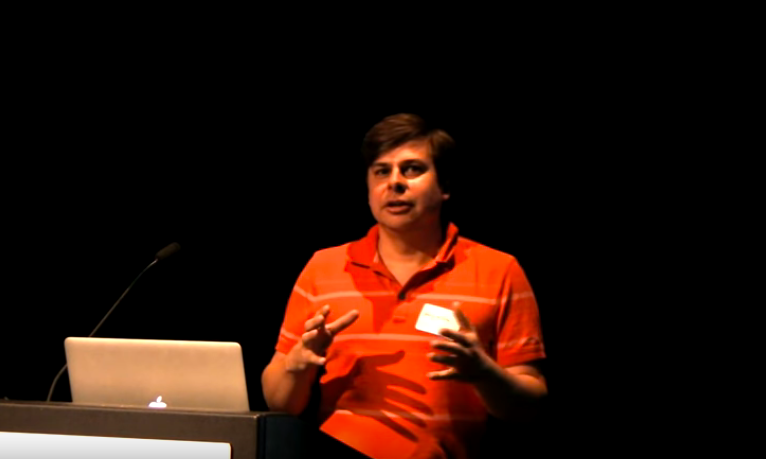
George Wilson at ZFS Day

For over 30 years, hard drives have designated the smallest storage location as 512 bytes. In January 2011, all major hard drive manufactures began shipping their hard drive platforms using a new standard called Advanced Format. To aid in the transition, these new hard drives provide a 512 byte emulation mode that allows the drives to advertise themselves as a 512 byte addressable devices. This can severely impact write performance resulting in the need for read-modify-write operations for any misaligned or partial writes that are issued.

The problem is not limited to just physical hardware. Other storage platforms may also provide LUNs (logical unit number) that presents themselves as a 512 byte addressable devices when, in fact, they use a 4K sector size internally. Although ZFS has built-in support for 4K sectors, it has no automatic way of dealing with the lies that the storage devices tell. This talk will focus on the methods that have been developed to work around the lies that hard drive storage platforms tell and will discuss the challenges and drawbacks that come with using 4K sectors.

Performance Analysis: The USE Method

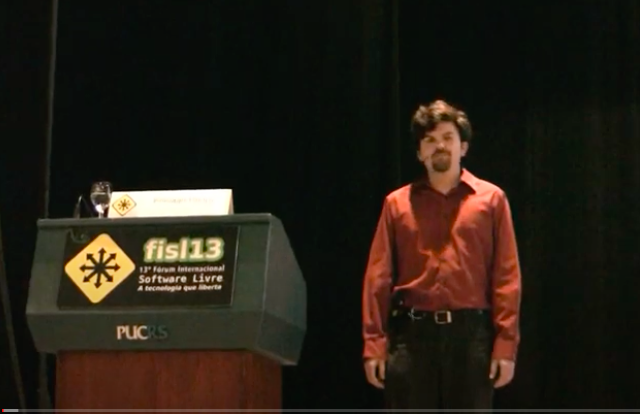
Brendan Gregg’s talk at FISL, July 2012.

This talk introduces the USE Method: a simple strategy for performing a complete check of system performance health, identifying common bottlenecks and errors. This methodology can be used early in a performance investigation to quickly identify the most severe system performance issues, and is a methodology the speaker has used successfully for years in both enterprise and cloud computing environments. Checklists have been developed to show how the USE Method can be applied to Solaris/illumos-based and Linux-based systems.

Many hardware and software resource types have been commonly overlooked, including memory and I/O busses, CPU interconnects, and kernel locks. Any of these can become a system bottleneck. The USE Method provides a way to find and identify these.

This approach focuses on the questions to ask of the system, before reaching for the tools. Tools that are ultimately used include all the standard performance tools (vmstat, iostat, top), and more advanced tools, including dynamic tracing (DTrace), and hardware performance counters.

Other performance methodologies are included for comparison: the Problem Statement Method, Workload Characterization Method, and Drill-Down Analysis Method.

Stuff I Do: dtrace.conf 2012

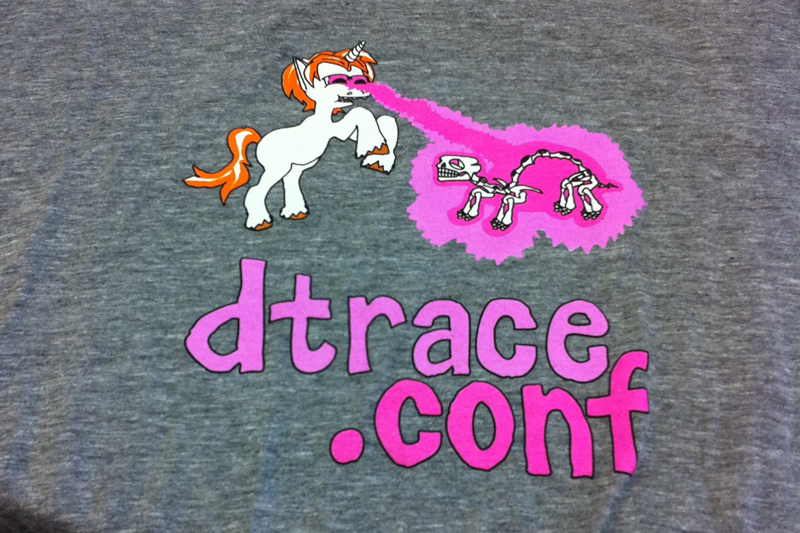
^ above: the famous DTrace laser pony designed by substack. Why a pony? Read here.

This week was eventful for me professionally. I organized and ran dtrace.conf 2012, a highly technical conference, for my employer and others of the tech community that works with this technology. Yes, this is the same DTrace as in that book that I edited in 2010.

I also filmed it and ran a live video stream, while publicizing it via Twitter. And making sure everyone got fed and, at the end of the day, had beer to drink. A very busy day, but all went very well. The final, edited video is now making its way to YouTube, see the playlist of videos above.